Server Room Dashboard
Real-time monitoring and alerting for a server room — sensors, servers, VMs, UPS, and switch on one live dashboard.
- React
- Vite
- FastAPI
- Python
- MySQL
- MQTT
- WebSocket
- SNMP
Screens
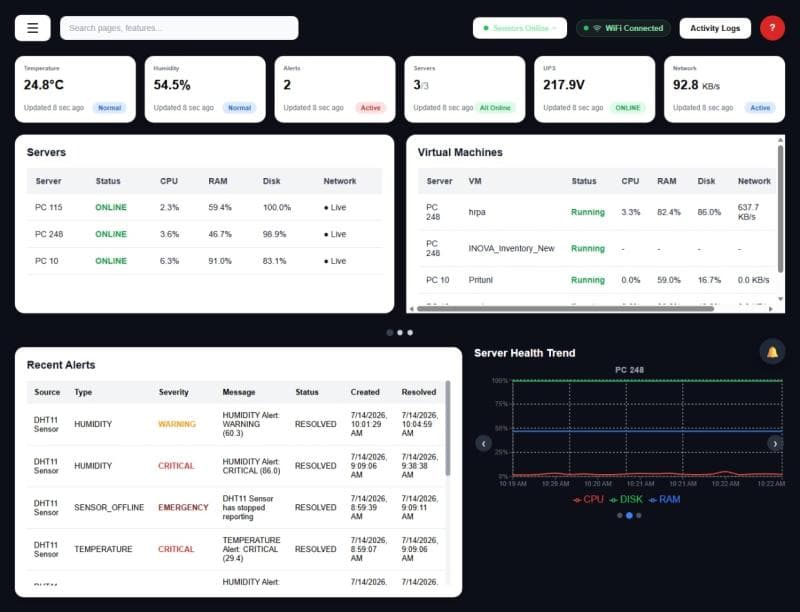
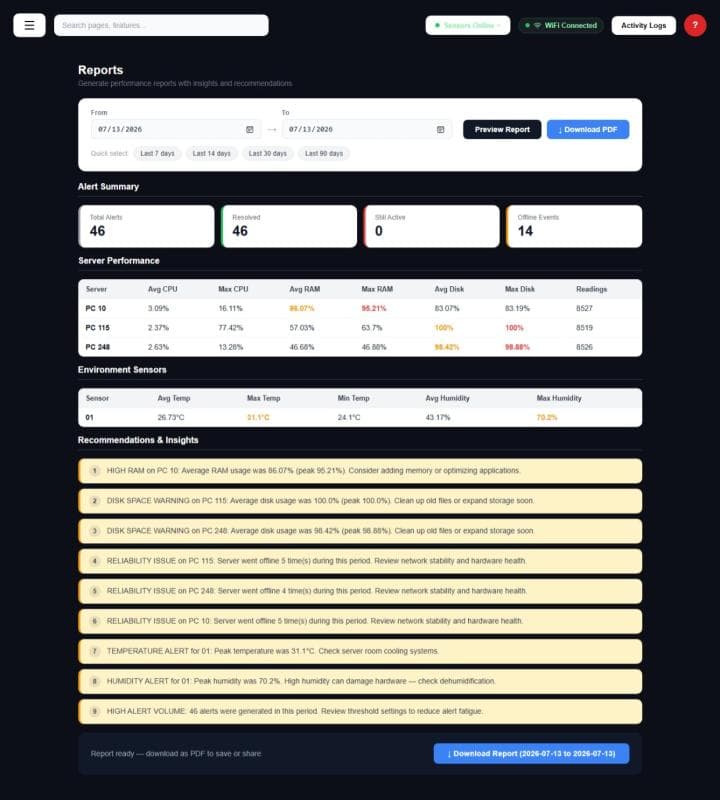
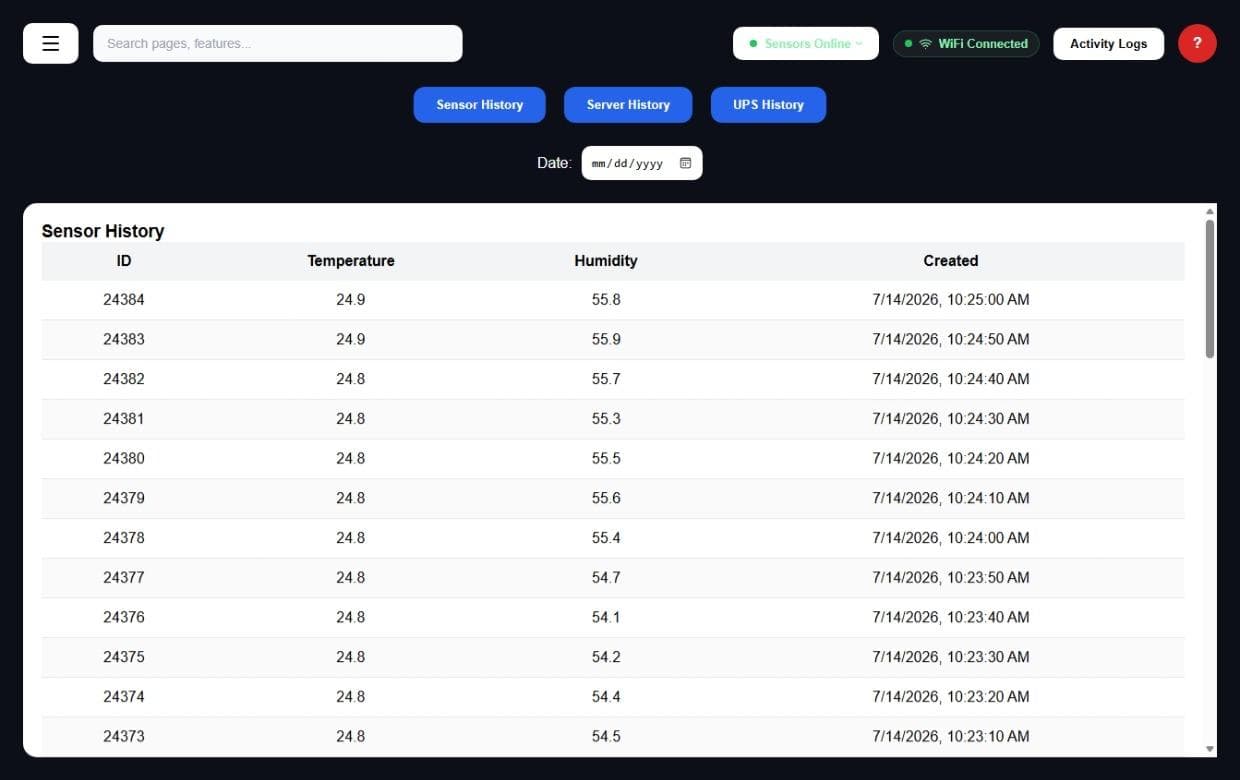
Problem
A server room only tells you something is wrong once a service breaks or somebody walks in and notices the heat. Temperature, humidity, disk space, and a UPS on mains are all knowable in advance, and none of it is any use as a reading nobody is looking at.
Role
Built both halves — the React/Vite dashboard and the FastAPI backend — plus the MySQL schema, the MQTT ingest, the per-device collectors, and the alerting pipeline.
Key decisions
Devices are collected two different ways because they behave two different ways: sensors and servers push over MQTT, while VMs (SSH/WinRM), the UPS (HTTP), and the switch (SNMP) are polled on a timer, since none of them will call you. Alerts are debounced rather than fired on the first bad reading — a single noisy sample is the fastest way to teach people to ignore an alarm. Each alert category has its own looping sound, so the fault is identifiable from across the room without reading the screen.
Challenges
The hard part was heterogeneous access, not the dashboard. Every device class authenticates differently, and credentials have to be added by hand from the admin screens, so a saved credential is tested on save rather than failing silently at the next poll. The three severity levels exist for the same reason the debounce does: without a gradient between 'worth knowing' and 'act now', everything becomes an emergency and the alerting stops working as alerting.
Outcome
Three-severity alerting with debounce across screen, sound, and email — a fault announces itself instead of waiting to be found.